Data-Driven Approach to Quantify Agricultural Losses from Flooding
Discover a method that combines Sentinel-2 satellite data, topographic information, and field surveys in a random forest model to classify flood damage in 412 agricultural fields, providing quantitative yield loss estimates for the 2023 Emilia-Romagna event and supporting effective compensation strategies in vulnerable areas.
Flood Impacts on Agriculture: Challenges and Significance
Climate change intensifies natural disasters, with floods being the most frequent, recording 164 events in 2023 that affected about 32.4 million people worldwide. These events cause extensive damage to urban and agricultural sectors, leading to substantial economic losses. In agriculture, a key economic driver, accurate damage quantification is vital for compensation mechanisms to aid farmers.
In Emilia-Romagna, Italy, a major agricultural region, the May 2023 floods resulted from over 200 mm of rainfall in 48 hours, a 200-year return period event, worsened by prior soil saturation and elevated sea levels impeding river outflow. This led to over 5,000 farms submerged and damages exceeding 8.5 billion euros. The region’s vulnerability persists, as seen in 2024 floods. Low insurance adoption among farmers places recovery costs on individuals and institutions.
Conventional methods for crop flood damage assessment, such as empirical damage curves or in-situ surveys, have limitations including oversimplified assumptions, high costs, time requirements, and inconsistent data in remote areas. Earth observation has advanced flood extent mapping in agricultural lands, but most studies delineate inundated areas without assessing yield loss severity. Approaches overlapping flood maps with land cover data quantify exposure but not damage intensity. Vegetation index methods using NDVI differences offer quick assessments but depend on predefined thresholds, reducing accuracy across crop types.
This gap hinders policy decisions, such as resource allocation under the Common Agricultural Policy. The study examines the 2023 Emilia-Romagna flood to demonstrate a data-driven method integrating remote sensing and machine learning for field-level crop loss evaluations, aiding compensation and resilience planning.
Methodology: Integrating Satellite, Elevation, and In-Situ Data
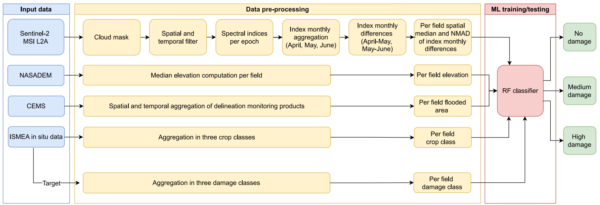
The methodology uses a random forest classification model trained on in-situ damage data from 412 fields in Emilia-Romagna, processed in Google Earth Engine and Colaboratory. Inputs include Sentinel-2 Level-2A imagery (10-20 m resolution, April-June 2023), NASADEM elevation (30 m), Copernicus Emergency Management Service flood maps (EMSR659, EMSR664), and Institute of Services for Agricultural and Food Market surveys.
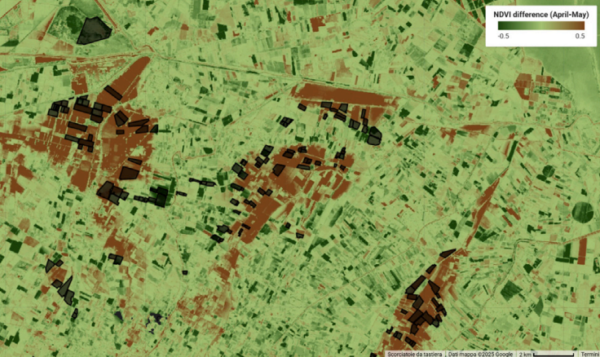
Sentinel-2 images, filtered for under 30% cloud cover, are masked with Cloud Score+. Monthly medians compute NDVI, LAI, and MNDWI. Differences (ΔNDVI, ΔLAI, ΔMNDWI) between April-May and May-June assess impacts and recovery, aggregated per field with medians and normalized median absolute deviation for variability. Field elevations derive from NASADEM medians; flooded percentages from merged Copernicus layers.
Damage percentage is (Potential Production – True Production) / Potential Production × 100, from expert plant sampling. Crops classify via EAGLE matrix: arable (50%), permanent (41%), herbaceous (9%). Damage classes: no (0%, 25% fields), medium (0-60%, 39%), high (>60%, 36%).
Features total 15: crop class, flooded area, elevation, Δ indices, and deviations. Nine models compare via mean F1 scores over 100 70/30 stratified splits; random forest performs best. Hyperparameters tune: n_estimators 75-400 (step 25), max_depth {None,10,20,30}, min_samples_split/leaf 2-5/1-5 (step 1), optimizing mean F1 over 50 subsets (n_estimators=250, max_depth=20, min_samples_leaf=1, min_samples_split=3).
Validation over 100 splits computes mean/standard deviation of metrics, confusion matrices, and feature importances. This integrates field-validated data for flood impact evaluation.
Results and Conclusions
The random forest model achieved mean overall accuracy of 0.74, with precision, recall, and F1 scores of 0.75, 0.74, and 0.74 (standard deviation 0.04 across 100 tests). It identified high-damage fields effectively, with 0.65% high misclassified as no-damage and 1.25% no-damage as high. Distinguishing adjacent classes proved challenging: 4.72% no-damage as medium, 5.14% medium as no-damage, 6.30% medium as high, and 8.19% high as medium.
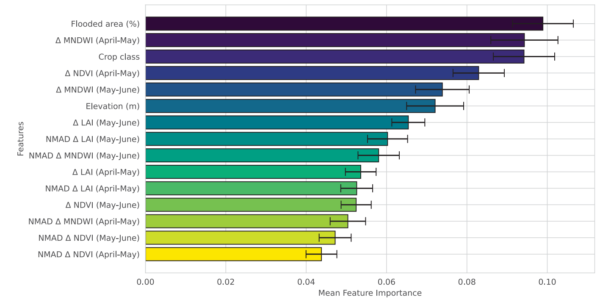
Feature importance ranked flooded area first, followed by ΔMNDWI April-May, crop class, ΔNDVI April-May, ΔMNDWI May-June, and elevation. High-damage fields averaged 62.67% flooded area and 2.42 m elevation, with notable vegetation declines.
Misclassifications differed by crop: medium-damage permanent crops often misclassified as no-damage (99.53%), due to canopy occlusion.
The framework provides quantitative yield loss assessment, trained on in-situ data, integrating features for decision support in flood-prone agriculture.
Implications and Future Potential
This method offers potential for broader application by incorporating radar data for cloud-free analysis, refined elevation models, or additional surveys, enhancing accuracy and adaptability to diverse flood scenarios worldwide.
We thank Filippo Bocchino and the team for their contribution to remote sensing and agricultural engineering. For insights or collaboration, contact via the paper. As noted, “the proposed framework relies entirely on freely available EO data, ensuring its applicability to other flood events.”
Reference: Bocchino, F., et al. (2026). Crop flood damage assessment integrating Sentinel-2 imagery and in situ data: the 2023 Emilia-Romagna case. Remote Sensing Applications: Society and Environment, 41, 101852. https://doi.org/10.1016/j.rsase.2025.101852.