High-frequency turbidity sensors from 134 USGS stations, paired with RUSLE erosion estimates and explainable random forest models, map sediment yield and delivery ratios across the contiguous United States, revealing that human-modified landscapes dominate sediment transport efficiency while natural factors control total production, and highlighting priority sub-basins for targeted management in the Upper Mississippi and Chesapeake Bay watersheds.
Unraveling the Sediment Puzzle: Why Delivery Efficiency Matters
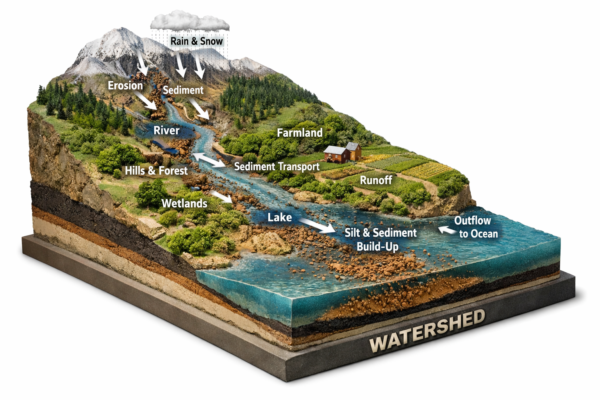
Sediment transport shapes river systems, floodplains, and coastal environments while supporting aquatic habitats and nutrient cycling. At the same time, excessive sediment degrades water quality, impairs ecosystems, accelerates reservoir sedimentation, and increases flood risks. Understanding the processes that govern sediment movement from hillslopes to river outlets is therefore essential for effective watershed management.
Two interrelated metrics are central to this challenge. Sediment yield (SY) measures the mass of sediment exported at a watershed outlet per unit area and time. The sediment delivery ratio (SDR) expresses the proportion of upland-eroded material that actually reaches the outlet, with the remainder stored or deposited within the basin. In practice, SDR values are often low—typically 20–30 %—reflecting the landscape’s capacity to retain sediment.
For engineers responsible for water-quality compliance, reservoir design, and TMDL development, these distinctions are critical. Conventional SDR estimates frequently rely on drainage-area relationships that overlook the combined effects of climate, topography, soils, land use, and infrastructure. As a result, spatial patterns of sediment production and delivery remain difficult to quantify at continental scales, limiting the precision of mitigation strategies in basins such as the Upper Mississippi River and Chesapeake Bay.
A Rigorous Data-Driven Framework: Sensors, Erosion Modeling, and Interpretable Machine Learning
Sugam Shrestha’s thesis addresses this need through a systematic integration of observational data and advanced analytics.
The analysis draws on 134 USGS gauging stations across the contiguous United States with 15-minute turbidity and discharge records spanning 2007–2022, supplemented by concurrent suspended-sediment concentration (SSC) grab samples. Site-specific linear regressions between turbidity (capped at 1,000 FNU and forced through the origin) and SSC were developed for stations meeting quality criteria: R² ≥ 0.5 and at least 10 paired observations. More than 70 % of candidate sites satisfied these requirements.
Continuous SSC time series were combined with discharge to compute sediment loads. Periods of missing data were infilled using a neural network model trained on the same sites (median Nash-Sutcliffe Efficiency of 0.78). Annual sediment yield was obtained by normalizing total load by watershed area.
SDR was then calculated as the ratio of observed SY to long-term upland erosion rates from the BasinATLAS RUSLE dataset, providing a consistent, observation-based measure of delivery efficiency.
Twenty standardized watershed attributes—covering climate, topography, hydrology, soils, land cover, and anthropogenic influences—were extracted from BasinATLAS. A random forest regressor (180 trees) was trained on 70 % of the data and evaluated on the remaining 30 %, achieving test R² values of 0.59 for SY and 0.60 for SDR. Bias in the positively skewed SDR distribution was addressed through Empirical Distribution Matching.
Shapley Additive Explanations (SHAP) were applied to quantify each predictor’s contribution and direction of influence. Spatial transferability was evaluated using the Area of Applicability (AOA) framework, which identifies locations where predictor combinations resemble the training data. The model was subsequently applied to HUC-12 sub-basins in the Upper Mississippi River Basin and Chesapeake Bay watershed, where more than 95 % of HUC-8 basins fell within the AOA. A bivariate quadrant analysis using Jenks natural breaks classified sub-basins into four regimes based on predicted SY and SDR.
Key Findings: Distinct Controls on Sediment Supply and Delivery
Derived SDR values exhibited a positively skewed distribution (mean 32.3 %, median 20.4 %), ranging from 1.5 % to 98.7 %. Higher delivery ratios were concentrated along the East Coast and in urbanizing areas of the Central Plains, while the Upper Mississippi River Basin generally showed lower delivery despite substantial upland erosion.
The random forest models identified markedly different drivers for the two metrics. For SDR, anthropogenic and land-cover factors exerted the strongest influence: cropland extent (negative relationship), urban area, pasture, and road density ranked highest. Hydro-climatic aridity—indicated by higher mean annual temperature and potential evapotranspiration—also favored greater delivery. Partial dependence plots revealed practical thresholds, including a sharp increase in SDR once road density exceeded approximately 3.5 km/km² and a decline when cropland coverage surpassed roughly 20 %.
In contrast, sediment yield was primarily governed by natural factors. Silt fraction emerged as the dominant predictor, followed by mean annual precipitation, soil water content, and wetland extent. This contrast underscores that sediment supply is more closely tied to inherent landscape erodibility and climate, whereas delivery efficiency is strongly modulated by human-induced connectivity.
Application to the focal basins reinforced these patterns. The Upper Mississippi displayed high sediment supply from agricultural areas but moderate delivery efficiency. The Chesapeake Bay watershed showed lower overall yields yet notably efficient transport in urbanizing landscapes. The resulting quadrant maps clearly delineate sub-basins where both high supply and high delivery coincide—prime candidates for coordinated intervention.
These results align directly with the author’s interpretation: “anthropogenic factors—including urban area, pasture area, and road density—exert stronger controls on SDR than natural drivers such as slope or precipitation, while the opposite relationship was observed for SY, where natural drivers prevailed over anthropogenic factors.”
Practical Implications for Watershed Engineering
The framework offers engineers a scalable, interpretable method for predicting sediment dynamics and prioritizing management actions. By distinguishing between supply-dominated and delivery-dominated systems, it supports more efficient allocation of resources—whether through upland erosion control, riparian buffers, or in-stream measures.
Continued growth of the national sensor network and refinement of remote-sensing datasets will allow periodic updates and broader application. The approach also provides a template for incorporating explainable AI into other complex environmental modeling tasks.
The research represents a valuable contribution to watershed science, combining rigorous data handling with clear mechanistic insights.
We extend our appreciation to Sugam Shrestha for this well-executed study. Practitioners working in sediment monitoring, watershed modeling, or data-driven water resources are invited to share perspectives or collaboration opportunities through the magazine’s contact channels.
Reference:
Shrestha, S. (2025). Why are some watersheds more sediment-productive than others? An explainable AI approach [Master of Science thesis, Virginia Polytechnic Institute and State University].