Utilizing GRACE gravity measurements, ERA5 precipitation records, and MODIS land cover classifications, this analysis examines seasonal and regional variations in groundwater storage across India, identifying negative correlations with cropland and urban expansion in northern areas while emphasizing the need for diversified water management to address ongoing depletion.
Groundwater Depletion in India: The Problem and Its Relevance
Groundwater accounts for approximately 99% of Earth’s liquid freshwater and serves as a primary resource in many regions. In India, it supplies 50-80% of domestic water needs and over 60% of irrigation requirements, with agriculture consuming about 90% of annual extractions. Data from GRACE satellites indicate unsustainable depletion in 21 of the world’s 37 largest aquifers, with the Gangetic Basin experiencing some of the highest rates globally, accompanied by seasonal fluctuations.
This depletion affects agricultural productivity, reducing yields of crops such as rice, wheat, and maize, and contributing to reduced cultivated areas. Urbanization increases impervious surfaces in cities like Delhi and Mumbai, impeding natural recharge. The expansion of irrigation systems in the 1960s in northern and northwestern regions supported agricultural growth but exceeded aquifer capacities, leading to changes in local climate, including lower surface temperatures and higher average precipitation due to increased evapotranspiration.
Precipitation is essential for recharge, with the summer monsoon providing 70-90% of annual rainfall, particularly in peninsular India. Variability in monsoon patterns, influenced by factors like reduced cyclonic activity, increases groundwater reliance during deficient periods, lowering storage levels. Non-monsoon precipitation, such as winter rains, may also contribute to recharge but has been less studied. The interactions among seasonal precipitation, land use/land cover changes (LULCC), and groundwater vary across India’s hydrogeological zones, highlighting the importance of regional assessments for sustainable resource management.
Study Methodology: Data Sources and Analytical Techniques
The research evaluates the effects of seasonal precipitation and LULCC on groundwater across four seasons defined by the India Meteorological Department: winter (January-February), pre-monsoon summer (March-May), monsoon (June-September), and post-monsoon (October-December). It focuses on five homogeneous precipitation regions,northwest, northeast, central-northeast, west-central, and peninsular, excluding Kashmir and Arunachal Pradesh.
Groundwater anomalies were derived from GRACE CSR RL06 Mascon data (0.25° grid, 2002-2023, relative to 2004-2009 baseline), subtracting GLDAS Noah model anomalies for soil moisture, snow water equivalent, and surface water: ΔGW = TWSA – ΔSM – ΔSWE – ΔSW.
Precipitation data were obtained from ECMWF ERA5 reanalysis (monthly, 2002-2022). LULCC data came from NASA MODIS MCD12C1 (annual, 0.05° resolution, 2001-2022), emphasizing croplands and urban areas, with validation using ground references and spectral indices.
Linear regression calculated trends: slope = [n ∑(x_i i) – ∑x_i ∑i] / [n ∑i² – (∑i)²], with p-values for significance. Correlations used r = [E(XY) – E(X)E(Y)] / [√σ²(X) √σ²(Y)], tested two-tailed, linking groundwater to precipitation and LULCC at regional scales. This approach addresses limitations in prior studies by incorporating non-monsoon seasons and multi-source data for a comprehensive view of hydrological dynamics.
Results and Conclusions
Precipitation trends varied regionally: the northeast showed declines in summer (-40.65 mm/decade) and monsoon (-76.48 mm/decade), with increases in winter and post-monsoon. The peninsular and west-central regions experienced rises across all seasons. Nationally, precipitation increased seasonally from 2002-2022.
LULCC included expansions in croplands (5073.61 km²/year, 9%), deciduous broadleaf forests (1828.51 km²/year, 53%), mixed forests (978.80 km²/year, 21%), and urban areas (108.81 km²/year, 5%), with declines in grasslands and barren lands. The northwest led cropland growth (3667.42 km²/year).
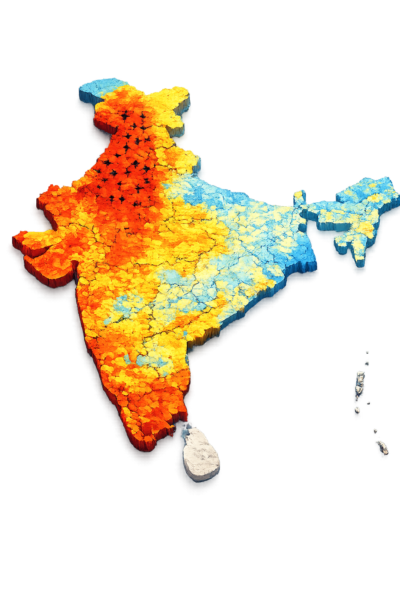
Groundwater declined nationally across seasons (p<0.001): summer (-6.52 mm/year), winter (-5.46 mm/year). The northwest experienced the steepest losses (-19.83 mm/year summer, -19.58 mm/year winter), central-northeast in monsoon (-11.16 mm/year), and northeast across seasons. West-central and peninsular regions showed gains in most seasons.
Correlations indicated negative relationships in northern regions between groundwater and cropland/urbanization (-0.65 to -0.85), with positives in west-central. Precipitation-groundwater correlations were negative nationally but positive in the northeast for monsoon and post-monsoon. The analysis shows that groundwater depletion is influenced more by extraction and LULCC than by precipitation variability in many regions.
Implications and Future Directions
The results suggest opportunities for developing region-specific models to predict and mitigate aquifer stress under changing climate conditions. “These findings underscore the necessity for integrated water management strategies, including optimizing and diversifying water sources for agriculture, promoting aquifer recharge, and enhancing wastewater treatment practices.”
Reference: Cao, Y., Sen Roy, S. Groundwater depletion in India: the influence of seasonal precipitation and land use land cover. Environ Sci Pollut Res (2025). https://doi.org/10.1007/s11356-025-37274-7.