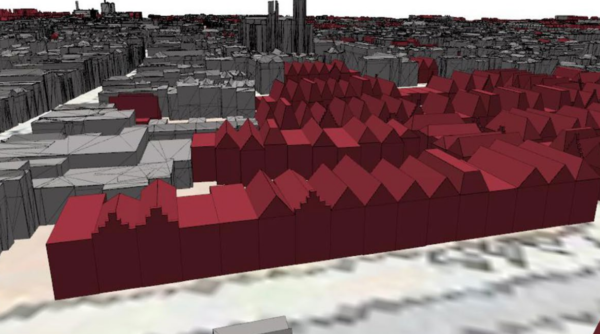
Researchers at TU Delft present a methodology to generate plausible 3D city models from scanned historical maps, using alignment, procedural modeling, and height inference to minimize manual work and support applications like population estimation, disease mapping, and spatial simulations for European cities between 1700 and 2000.
Challenges in Historical 3D City Modeling and Their Significance
Historical maps provide essential records of urban development, offering details on landscapes, economies, and societal shifts not available from other sources. Typically available as 2D scans of paper documents, these maps limit analyses that require three-dimensional representation, such as studying disease outbreaks, like the tuberculosis patterns in a 1900 Washington, D.C. map, or examining urban morphology and economic trends. Without height and volume, tasks like visibility assessments, wind flow simulations, solar potential evaluations, or population density estimates based on building structures are constrained.
3D city models, or digital twins, address these limitations by representing buildings and other urban features with depth, enabling multi-angle views and simulations unattainable in 2D. Studies have documented over 100 applications for 3D models, including pollutant tracking and microclimate evaluations. In historical applications, these models support heritage preservation, educational tools, and research, such as linking plague deaths in medieval Dijon to socioeconomic factors, potentially enhanced by 3D-derived population data.
Reconstructing historical 3D models remains challenging and time-intensive. Manual processes, such as the 1940 Rotterdam model requiring ten people for eight months, are resource-heavy. Historical maps often include geometric inaccuracies from traditional surveying methods like triangulation, as well as subjective cartography and incomplete coverage. Existing automated methods are limited: some require high-contrast maps, others are restricted to rectangular buildings. This creates a need for more flexible tools in urban informatics and GIS, where accessible historical 3D models could advance studies of city growth, infrastructure, and environmental history.
For engineers, these models facilitate data-driven simulations: population estimates for epidemiology, fluid dynamics for planning, or baselines for contemporary analyses. Without improved automation, opportunities to integrate historical data with modern techniques are restricted.
The Proposed Automated Reconstruction Methodology
The methodology generates LoD2 3D models, with roofs such as gables or hips, from georeferenced historical maps, supported by LiDAR point clouds and current 3D datasets. Implemented in open-source Python with tools like GRASS GIS, GDAL, and Blender, it requires minimal user input beyond training data and parameters like facade dimensions.
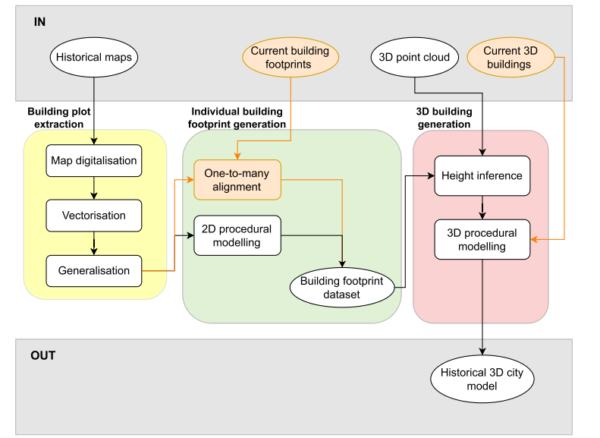
Step 1 involves extracting building plots through digitization. Maps are segmented into patches by color and shape using GRASS GIS, classified via object-based image analysis with labeled training points. A low-pass filter removes text and symbols, followed by vectorization with GDAL. Boundaries are generalized using algorithms from Arteaga (2013) and Commandeur (2012). Accuracy is measured by F-score for classification and shape metrics: turning function differences for contours, and Samal et al. (2004) for size and orientation.
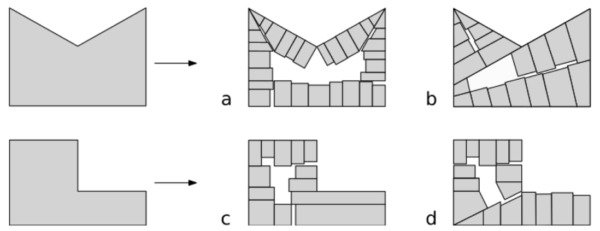
Step 2 subdivides plots into footprints using map alignment and 2D procedural modeling. Alignment compares historical plots to current footprints (pre-dating the map) with a 60% overlap threshold, reusing existing structures. For others, rules address five cases: small plots unchanged; single or double rows split along longest edges with variable lengths and depths; large plots offset via straight skeletons for courtyards; non-convex plots decomposed into convex parts per Bayazit (2009). Parameters are sourced from literature or aligned data.
Step 3 constructs 3D buildings. Ground heights derive from LiDAR medians per Dukai et al. (2019); roof heights from neighbor medians or historical regulations. Blender’s BCGA addon procedurally extrudes footprints, decomposes faces, and adds roofs (flat, hip, gable, mansard, or custom crow-stepped gables). Surfaces are semantically labeled per Biljecki et al. (2016a); outputs are CityJSON files validated by val3dity (Ledoux et al., 2019). Existing 3D models are reused for aligned buildings to reduce computation.
This approach accommodates diverse maps by automating extraction and inference, tested on Delft (1880-1982) and Brussels (1700-1924) with publicly available data and code.
Experimental Results and Key Findings
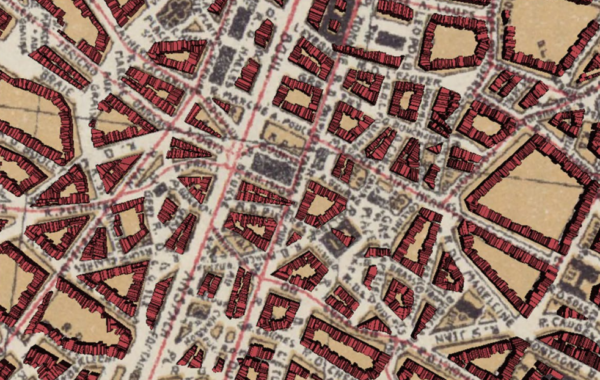
Tests achieved F-scores above 85% for four maps, indicating strong precision and recall, while others reached around 70% due to scan quality and cartographic variations. Shape metrics showed turning function differences of 0.90-1.37 and similarities above 90%, confirming preserved contours. Alignment overlaps averaged 60%; 2D procedural footprints were convex, with occasional misalignments from map inaccuracies.
Models were semantically accurate, with over 99% valid geometries. Delft models combined 3D BAG reusables with procedural buildings; Brussels used procedural only, with regulated heights. Visual evaluations verified proper facades and roofs, though sparse neighbors occasionally led to high-roof assignments.
The methodology effectively reconstructs plausible models from multicolored European maps, though special structures like churches may require manual adjustments. It supplements manual models when resources are constrained.
Future Implications and Research Directions
Extensions could include non-convex footprints, cross roofs, or features like trees and canals, while incorporating aerial photos for heights may yield more detailed models.
We thank Camille Morlighem, Anna Labetski, and Hugo Ledoux for this contribution. For collaboration or feedback, contact the 3D geoinformation group at TU Delft.
Reference: Morlighem, C., Labetski, A., & Ledoux, H. (2022). Reconstructing historical 3D city models. Urban Informatics, 1(11). https://doi.org/10.1007/s44212-022-00011-3.