Explore the spatial and temporal shifts in precipitation, evaporation, and streamflow linked to deforestation in the Madeira River basin, the Amazon’s largest sub-basin, through analysis of satellite, reanalysis, and observed data from 1981 to 2016, highlighting significant correlations that inform regional water resource strategies.
Deforestation Challenges in the Madeira River Basin
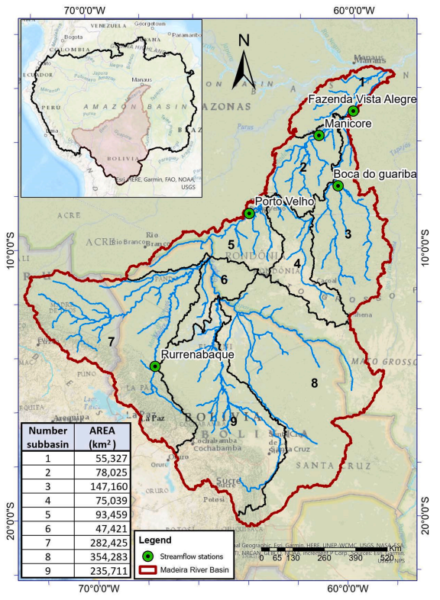
The Madeira River basin covers 1.37 million square kilometers across Bolivia (51 percent), Brazil (42 percent), and Peru (7 percent), serving as the largest tributary to the Amazon River. This transboundary region supports ecosystems, agriculture, and populations, but faces deforestation at an average rate of 2,810 square kilometers per year from 2001 to 2020. The basin receives an average annual rainfall of 1,834 millimeters, with variations from 255 millimeters per year in Andean highlands to over 3,000 millimeters per year in lowlands. The wet season extends from December to May, with peaks in January to March, while the dry season lasts from June to November, with minima in June to August. Streamflow peaks occur two months after rainfall maxima, from March to May, with minima from August to October.
For engineers, these changes affect river flows, flood risks, and water availability. Global studies indicate varied outcomes: forest loss can reduce evapotranspiration and streamflow in some areas, or increase streamflow in others. In the Amazon, results differ, with some showing reduced evapotranspiration and streamflow in southern regions, while others report increases. In the Madeira basin, hydroclimatic trends and forest loss have been noted, but spatial and temporal connections to hydrological changes were previously underexplored. These dynamics require consideration in infrastructure design, such as dams and flood systems. Transboundary aspects call for coordinated approaches. Lessons from this basin apply to other tropical areas where land use intersects with climate variability.
Methodological Framework: Data Sources and Analytical Techniques
Researchers from Delft University of Technology and IHE Delft analyzed data from 1981 to 2022, with land cover focused on 2001 to 2020. The study used nonparametric statistical methods at basin, subbasin, and pixel scales to examine deforestation’s effects amid climate variability.
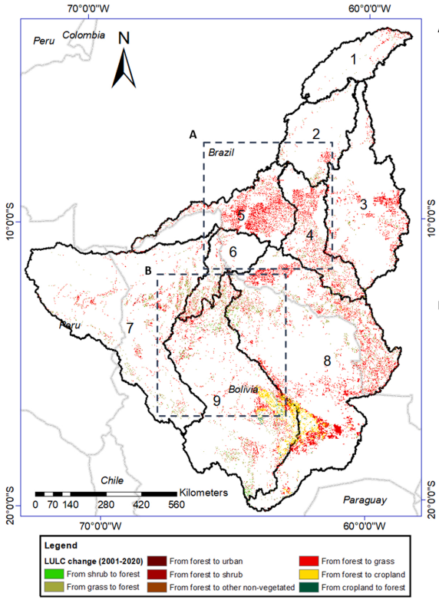
Data included land cover from MODIS MCD12Q1 at 500-meter resolution, reclassified into eight categories via ArcGIS. Precipitation came from CHIRPS v2.0 at 0.25-degree resolution, with correlations over 0.6 against Amazon gauges. Evaporation was from GLEAM v3.8a at 0.25-degree resolution, showing correlations of 0.78 to 0.81 with flux towers. Streamflow data from five stations (ANA, SO-HYBAM, CAMELS-BR) had less than 5 percent missing values. A water balance check comparing precipitation minus evaporation to discharge showed differences of 17 to 32 percent, acceptable for large-scale studies.
The analysis comprised three steps. Land cover changes quantified net and gross forest loss, rates, and transitions at basin, country, and nine subbasin levels, using HydroSHEDS for delineations.
Trend and change-point detection used the Mann-Kendall test at a 0.1 significance level, with pre-whitening for autocorrelation. Theil-Sen slopes estimated magnitudes, and Pettitt tests identified shifts, followed by t-tests on periods. Spearman rank correlations examined relations between forest area and fluxes from 2001 to 2015, including values and changes. This framework addressed nonlinearities and feedbacks, using Python for implementation.
Research Findings: Associations Between Forest Loss and Hydrological Fluxes
Net forest loss totaled 53,471 square kilometers (3.91 percent of the basin) from 2001 to 2020, with an average deforestation rate of 2,810 square kilometers per year. Gross losses were highest in Brazil at 37,380 square kilometers, mostly to grassland. Subbasins 4 and 5 experienced the most gross loss, at 9.4 percent and 12.2 percent.
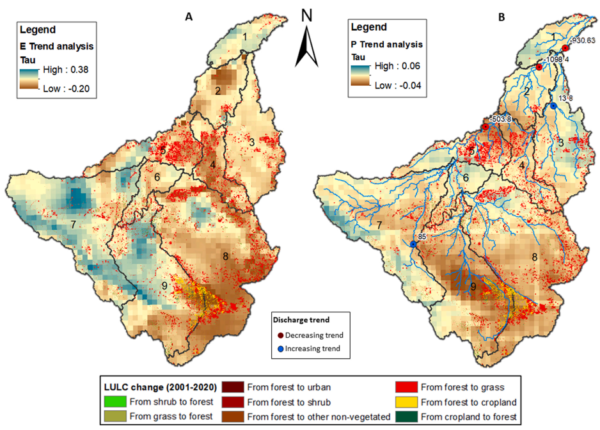
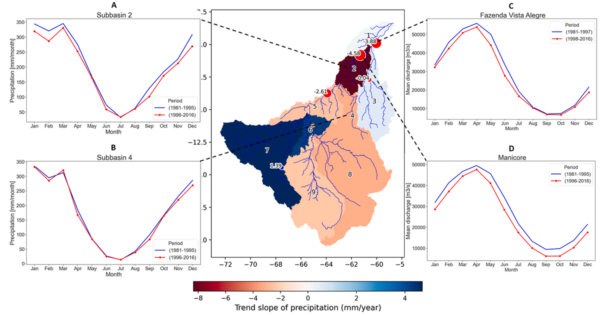
From 1981 to 2016, significant negative trends included precipitation in subbasins 2 and 4 (-8.3 and -3.1 millimeters per year); evaporation in subbasins 4 and 8; and discharge at the Manicore station (-4.5 millimeters per year), with a 34 percent October reduction post-1996 change point. Pixel analysis indicated evaporation declines (tau less than 0.4) in deforested areas.
Correlations from 2001 to 2015 showed positive links between forest area and evaporation annually (r=0.5 in subbasins 3 and 5) and in wet months (r=0.73, p less than 0.1), with changes at r=0.47. Forest-discharge relations were negative (r=-0.46 at Porto Velho, p less than 0.1), reaching r=-0.6 in May, with changes at r=0.48. These results support the view that deforestation reduces evaporation, disrupts moisture recycling, and may increase wet-season streamflow, while long-term trends suggest a slowed water cycle.
Future Directions: Applications in Engineering and Research
Findings suggest opportunities for hydrological modeling to separate deforestation effects from climate influences, using enhanced data for policy development in transboundary settings.
Reference: Torres, E., et al. (2025). Spatial and temporal analysis of changes in hydrological fluxes and their relation to deforestation in the Madeira River basin. Journal of Hydrology: Regional Studies, 61, 102680. https://doi.org/10.1016/j.ejrh.2025.102680.