Dutch Study Integrates Sparse GPS and Traffic Signal Data to Double Model Fit in Estimating Average Bicycle Delays, Providing Insights for Traffic Management, Cycling Policy, and Infrastructure Development in Urban Environments
Addressing Bicycle Delays in Urban Transportation Networks
Bicycle use has increased in urban areas as a sustainable alternative to cars for short to medium trips, driven by e-bikes and shifts during the COVID-19 pandemic. Cities are implementing policies to restrict car access in centers, reduce emissions, and allocate space for pedestrians and cyclists. This includes improving connections to public transit and offering benefits for public health and socioeconomic factors.
Rising cycling demand stresses urban networks, particularly at signalized intersections where delays serve as indicators of efficiency. These delays affect cyclists’ route choices, safety, and the appeal of cycling. Excessive or unpredictable delays may lead to red-light violations and reduced reliability, impacting commuters and recreational users. While vehicular traffic research spans decades, bicycle flow understanding remains limited due to underreporting in surveys and data challenges.
Field studies for delay measurement are resource intensive, and analytical models struggle with oversaturated conditions. Artificial intelligence has improved vehicle delay estimation, but applications for bicycles are limited by behavioral differences and sparse data. The Talking Bikes program in the Netherlands provides GPS cycling data, though sparse with variable sampling. Local VLOG data on signal phases and detections for modes correlates with delays but is available municipally. Quantifying bicycle delays supports signal optimization, cycling policies, and sustainable urban mobility.
Research Approach and Innovations
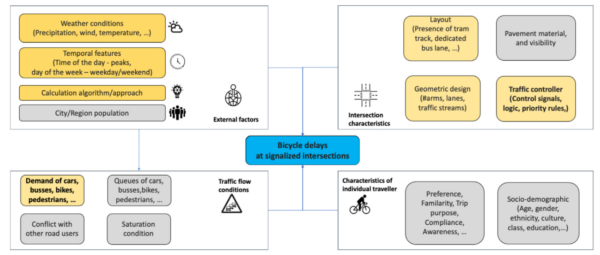
The study presents a machine learning framework to estimate average bicycle delays at signalized intersections, extending prior research by adding VLOG traffic control data for improved performance and transferability. A conceptual model groups delay influences into traveler characteristics, intersection features like geometry and signals, traffic conditions such as demand and queues, and external factors including weather and time. Using available data, the framework incorporates sparse GPS from Talking Bikes (over one million annual trips, median seven reporting points, 407-552 second durations), VLOG records on timings and detections, KNMI weather data on precipitation, temperature, and wind, temporal variables like weekday, hour, and peak indicators, and intersection topology including arms, lanes, streams, and tram/bus presence.
Experienced delay, the dependent variable, is the difference between observed travel time from upstream to downstream GPS points and free-flow time at 4 m/s reference speed, grouped by right turns, through movements, and left turns. Independent variables include weather metrics like precipitation duration and intensity, temporal features, aggregated VLOG data such as mode detections and relative green times over five-minute intervals, and topological attributes.
Five regressors are evaluated: random forest, k-nearest neighbors, support vector regression, extreme gradient boosting, and neural networks, against linear regression. Data splits 80/20 stratified by intersection ID, tuned with grid search and five-fold cross-validation to avoid overfitting. Metrics are R² for explained variance and RMSE for error on log-transformed delays to address skewness. Correlation checks multicollinearity, noting random forest’s handling of non-linear ties.
Tested in two scenarios: Scenario 1 on one four-armed intersection (332 trips) compares with and without VLOG; Scenario 2 on two intersections (504 trips) uses consistent variables, omitting some VLOG features. The approach fuses real-world sparse GPS with VLOG under constraints, deriving delay patterns without preprocessing like map-matching, showing feasibility for transportation applications.
Key Results and Conclusions
Random forest outperforms others, with strong R² and RMSE by managing non-linear interactions and outliers. In Scenario 1, it yields training R² of 0.777 and RMSE of 0.899 (log), testing R² of 0.159 and RMSE of 1.599 (log) with VLOG, improving over no VLOG (R² 0.131, RMSE 1.625). Scenario 2 achieves testing R² of 0.242 and RMSE of 1.734 (log) with VLOG, doubling fit from prior 10% R² on 18 intersections without VLOG.
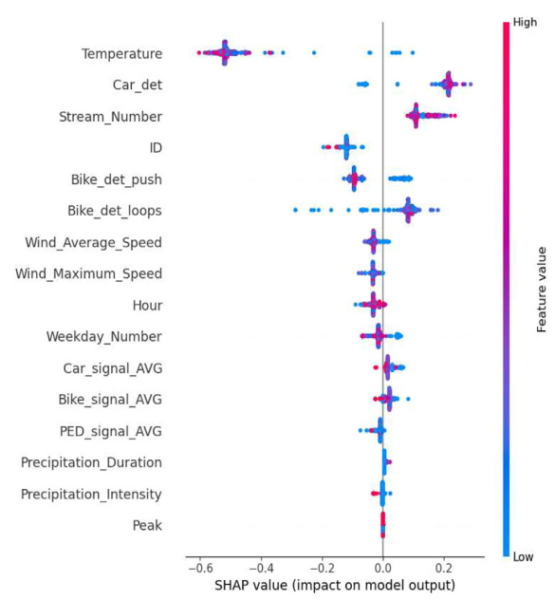
Delay distributions align on medians but overestimate short delays and underestimate long ones, especially left turns due to small samples and complexity. Feature importance prioritizes temperature (warmer reduces delays), car green times, bike/car detections (higher increase delays), and temporal/turning factors. Scenario 2 SHAP analysis confirms temperature’s negative effect below 11°C, bike request buttons reducing delays, and high detections increasing them.
The study concludes that weather, temporal, topological, and traffic variables enable delay estimation, with VLOG doubling model fit and supporting data-driven traffic management and policy.
Implications and Future Directions
Broader application across networks may support real-time apps and adaptive signals for urban mobility. Contact y.yuan@tudelft.nl for insights on bicycle delay estimation. As the authors state, “insights gained from the estimation model emphasize the potential of data-driven approaches to inform traffic management, bicycle policy, and infrastructure development.”
Reference: Yuan, Y., Wang, K., Duives, D., Daamen, W., Hoogendoorn, S.P. (2025). Machine learning-based bicycle delay estimation at signalized intersections using sparse GPS data and traffic control signals – A Dutch case study using random forest algorithm. Artificial Intelligence for Transportation, 3–4, 100037. https://doi.org/10.1016/j.ait.2025.100037